Research - Clinical Schizophrenia & Related Psychoses ( 2021) Volume 15, Issue 4
Role of Susceptibility Weighted Magnetic Resonance Imaging in Neurological Diagnosis
Ajit Mahale*, Mithun Shekar, Sonali Ullal, Merwyn Fernandes, Sonali Prabhu and Keerthiraj BeleAjit Mahale, Department of Radio Diagnosis, Kasturba Medical College, Mangalore, Manipal Academy of Higher Education, Manipal, India, Tel: +919844075363, Email: qjitmahale137@gmail.com
Received: 10-Jun-2021 Accepted Date: Jun 24, 2021 ; Published: 01-Jul-2021
Abstract
Objectives: The role of susceptibilities in a magnetic field can be used for imaging a diverse group of disease patterns in the human body. The objective of this study is to utilize these properties in the spectrum of neurological diseases.
Materials and methods: This is a prospective and retrospective study conducted in the department of radio diagnosis, KMC Hospital, Ambedkar Circle in Mangalore. Over a period of 3 years, utilizing 1.5 Tesla magnetic resonance imaging machine on subjects who had come for routine neurological consultation with clinical indications for imaging. 129 patients of any age group with suspected haemorrhage, infarct, trauma, seizures, intracranial infections, intracranial venous thrombosis and vascular malformations were studied.
Results: A total of 129 subjects were studied-40 cases of acute stroke,40 cases of haemorrhage, 8 cases with suspected micro haemorrhages, 15 cases of venous thrombosis, 11 cases of calcifications and 14 cases of contrast enhancement manifesting on SWI imaging in the form of varied susceptibilities to clinch the diagnosis and enable appropriate treatment.
Conclusion: Susceptibility weighted imaging is an effective and useful diagnostic tool in magnetic resonance imaging diagnosis for a variety of neurological conditions.
Keywords
Magnetic Field • Trauma • Infections
Introduction
Susceptibility Weighted Imaging (SWI) is an imaging sequence in Magnetic Resonance Imaging (MRI) of the brain, which utilizes magnitude and filtered-phase information, both separately and in combination with each other, to create new sources of contrast. The term susceptibility- weighted imaging has been used by various authors to indicate sequences that are sensitive to T2*Gradient Echo (GRE) techniques. SWI has also been referred to as High-Resolution (HR) Blood Oxygen Level-Dependent (BOLD) venography [1,2].
Susceptibility Weighted Imaging exploits the magnetic susceptibility differences of various tissues, such as blood, iron and calcification. The hemorrhagic component in the region of ischemia can be detected with the use of SWI [3]. Hemorrhage in the brain undergoes several stages. Earliest transition is the conversion of oxyhemoglobin to deoxyhemoglobin. This paramagnetic deoxyhemoglobin causes a signal loss on T2* gradient images SWI [4]. Susceptibility sign is more sensitive in depicting acute thrombus as compared to FLAIR hyper intensity of the occluded vessel or hyper dense sign on Computerized Tomography (CT) [5].
Micro hemorrhages can be detected only on SWI images in a posttraumatic patient with altered sensorium and normal CT study [6]. High sensitivity of SWI in detecting cerebral venous thrombosis has been reported in prior studies [7]. SWI showed increased sensitivity in detecting calcification as compared to CT imaging [8].
Calcium deposits associated with tumors, cerebrovascular diseases, congenital conditions, trauma and endocrine/metabolic disorders are considered pathological calcifications. The location and characteristics of the calcification in these lesions are very important indicators in diagnosis and differential diagnosis [9]. The volume of hemorrhage and depiction of a number of small hemorrhagic lesions were also more accurate in SWI than on conventional GRE sequence [10]. Hence we studied the role of Susceptibility Weighted Imaging (SWI) in neurological diagnosis.
Materials and Methods
A prospective and retrospective study was conducted in the Department of Radiology KMC Hospital, Ambedkar Circle, Mangalore. Using a 1.5 T MRI system-Magnetom Siemens AvantoGermay. The duration of the study was three years from 2017-2019. Total sample size considered was 129 patients of any age group. Only patients with clinical indication for MRI with consent for the study were included and patient anonymity was adhered to during the study.
Study design
Prospective and retrospective comparative study of all routine MRI sequences with SWI was done. Inclusion Criteria were patients suspected with haemorrhage and infarct, trauma, seizures, past/present history of intracranial infections to detect calcifications; intracranial venous thrombosis/malformations were considered for the study. Exclusion criteria were patients with intracranial aneurysm clips or Intra-orbital metal fragments. Any electrically, magnetically or mechanically activated implants (including cardiac pacemakers, bio stimulators, neuro stimulators, cochlear implants, and hearing aids) and patients having claustrophobia.
Statistical analysis
Data analysis was done in SPSS version 17.0 using chi-square test and Fisher`s test. Sequences taken were– Axial SWI, T1 WI, T2 WI, FLAIR , DWI and post contrast T1WI (if indicated). Parameters used for SWI were- TR/TE, 49/40 ms, Flip angle -15°. A rectangular Field Of View (FOV), 7/8, Slice thickness -2.2 mm. MinIP reconstructions, FOV –230 mm. Slices per slab –56.
All patients who fulfilled the inclusion criteria were subjected for MRI in 1.5 Tesla Magnetom Siemens Avanto machine and the following parameters were assessed: Detection of haemorrhage in acute ischemic stroke territory, venous congestion, SWI MCA sign, FLAIR hyper intense MCA sign and vascular territory of the ischemic stroke. Analysis of micro haemorrhages and region of involvement, extra-axial and intra parenchymal haemorrhage in patients among SWI, T1, T2, FLAIR sequences and if available CT images. Analysis of the different stages of intra parenchymal hematoma and detecting the blooming characteristics of SWI. Assessment of micro bleeds among hypertensive and non-hypertensive patients. Assessment of micro bleeds association with intra parenchymal haemorrhage. Analysis of cerebral dural and cortical venous thrombosis, associated venous congestion among SWI, T1, T2, FLAIR and MRV sequences. Analysis of parenchymal calcifications and comparison of phase hyper intense rim surrounding calcification with post-contrast T1 weighted enhancement. Application of magnitude SWI images in the detection of arterial feeders and draining veins in cerebral arteriovenous malformations. SWI features in cerebral vascular malformations.
Results
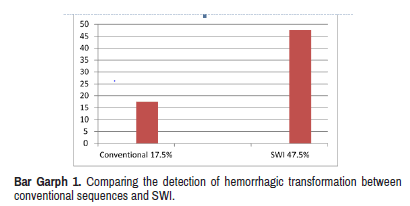
Total 40 cases of acute stroke with positive restricted diffusion in the ischemic area were considered for analysis. Blooming on SWI was noted in total 19 cases out of 40 (47.5%) which was considered to be a hemorrhagic transformation in the infarcted area. Bleed was recognized only in 3 patients on T1 WI and only 4 patients on T2/FLAIR sequences (Bar Graph 1). 18 patients underwent CT before MRI with Hypodense area on CT suggesting infarction was seen in 10 cases out of 18 and8 cases were normal. None of the 18 cases showed the hemorrhagic transformation on CT.
Twenty-two patients (55%) had venous congestion in the infarcted area on SWI. Only the SWI sequence showed venous congestion. Venous congestion was not visualized in any of the conventional sequences. There was 100% sensitivity when compared to conventional sequences (p=0.001).
Total of 19 cases out of40 studied showed acute thrombosis. SWI sign was positive in 18 cases (94%) and negative in 1 case. FLAIR sign was positive in 8 cases (42%) and negative in 11 cases (λ2 p=0.002-statistically significant).
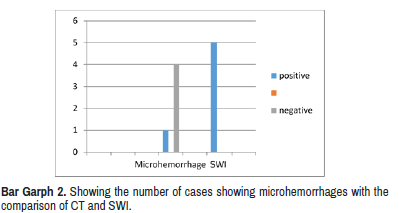
Five cases showed micro haemorrhages, depicting diffuse axonal injury on SWI. Only one CT study depicted micro bleed (Bar Graph 2).
Total of 40 cases was analyzed for SWI features in intracranial micro bleeds. In which 18 patients presented with micro bleeds, 13 patients were hypertensive (72%). On analysis of the number of micro bleeds in each case associated with hypertension, 9 patients with hypertension showed micro bleeds.
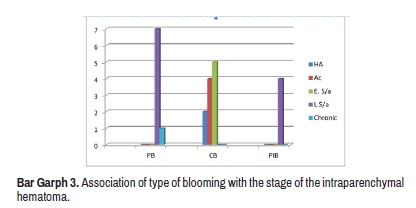
There were 23 cases of intra parenchymal hematoma out of 40. Blooming characteristics were divided into Complete Blooming (CB), Patchy Internal Blooming (PIB) and Peripheral Blooming (PB) in the region of the hematoma. Total of 47 % of cases showed CB–2 cases in the Hyper Acute stage (HA), 4 in Acute (Ac) and 5 cases in early (E.S/a) subacute stage. Out which 34% showed PB–7 cases in late subacute stage (L.S/a) and 1 in the chronic stage and 17% showed PIB-4 cases in late subacute stage (Bar Graph 3).
Total of 7 cases showed subarachnoid haemorrhage among 40 patients. SWI was able to show hypo intense signal intensity in the region of subarachnoid haemorrhage in all 7 cases. Only SWI showed SAH component in 3 cases (42%). Conventional sequences showed altered signal intensity in 4 cases along with SWI (57%). There was no case where SWI was negative and conventional sequences showed SAH. In all 7 cases, CT was done to confirm the subarachnoid haemorrhage.
There was 100% detection of the blooming of thrombosed superior sagittal sinus when compared with conventional MRI sequences. In 7 cases out of 15 studied, there was superior sagittal sinus thrombosis. Six cases out of 15 (including both unilateral and bilateral transverse sinuses) showed transverse sinus thrombosis. Sigmoid sinus thrombosis was visualized in 7 cases. All Transverse and sigmoid sinus thrombosis were seen with 100% sensitivity on SWI. All 7 cases of cortical vein thrombosis were detected on SWI (100% sensitivity), these results have high statistical significance (Fisher`s exact test p=0.001).
In 8 out of 15 cases SWI was the only sequence which detected venous congestion with 100% sensitivity, as compared to other conventional sequences.
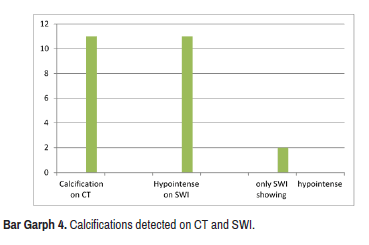
In 12 Cases with calcifications hypo intensity wasseen on SWI .11 cases showed blooming on SWI and were detected on CT. There was 1 case which showed blooming on SWI but was negative on CT study (Bar Graph 4).
Contrast enhancement was studied in 14 cases. Phase showed the peripheral rim of hyper intensity in 10 cases with blooming. Peripheral rim hyper intensity was absent in 4 cases.
Discussion
Susceptibility weighted imaging plays an important role in the imaging of acute stroke patients. Among 40 cases, 47.5% cases showed blooming (hypo intense signal suggesting haemorrhage) on SWI, and only 17.5% cases showed signal intensity changes suggestive of haemorrhage on conventional sequences (T1, T2/FLAIR images). This is comparable to previous studies who have done similar comparisons in cases of acute stroke [11, 12].
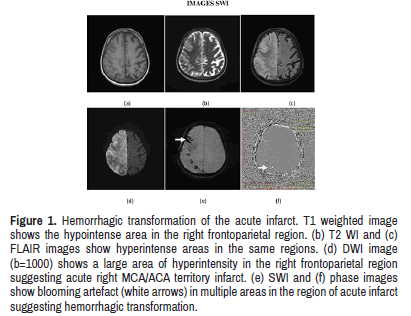
Illustrates the example of the sensitivity of SWI in detecting hemorrhagic transformation.
Venous congestion was detected in 55% of cases among a total of 40 cases. SWI was the only sequence to detect the venous congestion making it 100 % sensitive. None of the conventional sequences could detect venous congestion. This is due to thin imaging sections used in SWI and high sensitivity of SWI to deoxyhemoglobin products as described other studies [13](Figure 1).
Figure 1: Hemorrhagic transformation of the acute infarct. T1 weighted image shows the hypointense area in the right frontoparietal region. (b) T2 WI and (c) FLAIR images show hyperintense areas in the same regions. (d) DWI image (b=1000) shows a large area of hyperintensity in the right frontoparietal region suggesting acute right MCA/ACA territory infarct. (e) SWI and (f) phase images show blooming artefact (white arrows) in multiple areas in the region of acute infarct suggesting hemorrhagic transformation.
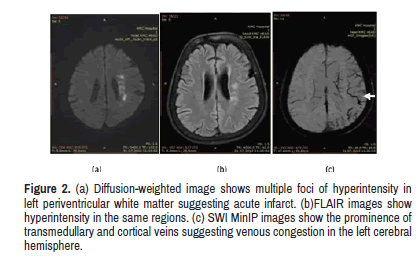
Demonstrates acute infarct with venous congestion detected on SWI MinIP images.
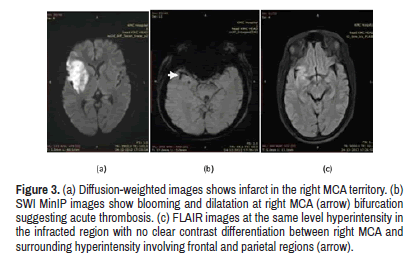
Detection of acute thrombosis is important in deciding the thrombolytic therapy and SWI helps in localisation of the thrombus [14] (Figure 2). In 18 cases out of 40, SWI sign was positive, FLAIR sign was positive in8 cases which were statistically significant (λ2, p=0.002). Figure 3 shows higher sensitivity of SWI in detecting thrombosis-SWI was compared to other conventional sequences-T1, T2 and FLAIR sequences.
Figure 2: (a) Diffusion-weighted image shows multiple foci of hyperintensity in left periventricular white matter suggesting acute infarct. (b)FLAIR images show hyperintensity in the same regions. (c) SWI MinIP images show the prominence of transmedullary and cortical veins suggesting venous congestion in the left cerebral hemisphere.
Figure 3: (a) Diffusion-weighted images shows infarct in the right MCA territory. (b) SWI MinIP images show blooming and dilatation at right MCA (arrow) bifurcation suggesting acute thrombosis. (c) FLAIR images at the same level hyperintensity in the infracted region with no clear contrast differentiation between right MCA and surrounding hyperintensity involving frontal and parietal regions (arrow).
Micro haemorrhages were better seen on SWI in all 8 cases compared to conventional sequences. There was statistical significance when individual conventional sequences were taken into consideration, in comparison with SWI (Fisher`s exact test p=0.002) (Figure3).
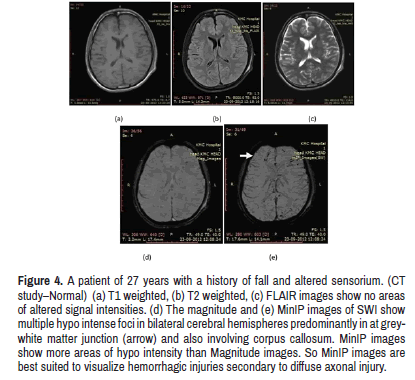
Micro haemorrhages were detected only on SWI images in a posttraumatic patient with altered sensorium and normal CT study. These results are similar to previous studies [15] (Figures 4 and 5).
Figure 4: A patient of 27 years with a history of fall and altered sensorium. (CT study–Normal) (a) T1 weighted, (b) T2 weighted, (c) FLAIR images show no areas of altered signal intensities. (d) The magnitude and (e) MinIP images of SWI show multiple hypo intense foci in bilateral cerebral hemispheres predominantly in at greywhite matter junction (arrow) and also involving corpus callosum. MinIP images show more areas of hypo intensity than Magnitude images. So MinIP images are best suited to visualize hemorrhagic injuries secondary to diffuse axonal injury.
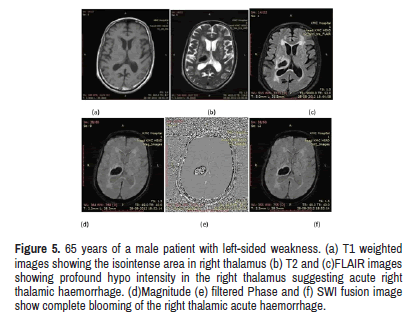
Figure 5: 65 years of a male patient with left-sided weakness. (a) T1 weighted images showing the isointense area in right thalamus (b) T2 and (c)FLAIR images showing profound hypo intensity in the right thalamus suggesting acute right thalamic haemorrhage. (d)Magnitude (e) filtered Phase and (f) SWI fusion image show complete blooming of the right thalamic acute haemorrhage.
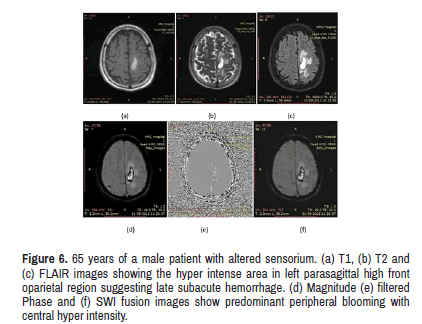
The blooming characteristics on SWI were assessed in a different stage of hematoma, divided into Complete Blooming (CB), Patchy Internal Blooming (PIB) and Peripheral Blooming (PB) in the region of a hematoma. A peripheral rim of blooming was noted mainly in late subacute hematoma and a single case of the chronic hematoma. Complete blooming was seen as hyper acute, acute and early subacute stages. shows an acute hematoma with complete blooming. Figure 6 shows late subacute hematoma with a peripheral rim of blooming. Blooming characteristics of 2 cases of hyper acute hematoma in our study were in contrast to Linfante, et al. study which showed central hyper intensity in a hyper acut ehematoma [15,16] (Figure5).
Figure 6: 65 years of a male patient with altered sensorium. (a) T1, (b) T2 and (c) FLAIR images showing the hyper intense area in left parasagittal high front oparietal region suggesting late subacute hemorrhage. (d) Magnitude (e) filtered Phase and (f) SWI fusion images show predominant peripheral blooming with central hyper intensity.
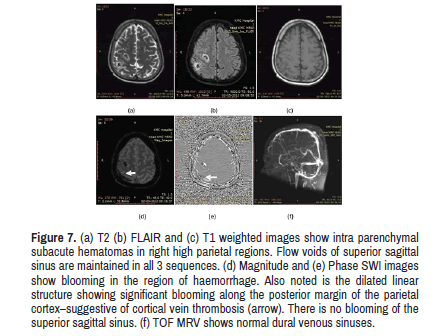
SWI had a high detection rate of cortical vein thrombosis even better than MRV. T1 and FLAIR showed cortical vein thrombosis in 1 case and MRV was positive in 3 cases. Cortical vein thrombosis was considered to be present by the description of the blooming in thrombosed vein given in the literature [17]. SWI plays a major role in this area of cortical vein thrombosis with high statistical significance (p=0.001) (Figure 6).
Shows isolated cortical vein thrombosis detected on SWI Magnitude and Phase images with venous haemorrhage in the right parietal region. Cortical vein thrombosis was noted detected on conventional sequences and TOF MRV.
Blooming was visualized in 17 cases of calcifications. Only 13 cases showed a hypo intense signal on the conventional sequence, again this is due to the thin sections of SWI imaging and very high sensitivity to pick up the diamagnetic signal intensity especially on the magnitude and MinIP series [18] (Figure 7).
Figure 7. (a) T2 (b) FLAIR and (c) T1 weighted images show intra parenchymal subacute hematomas in right high parietal regions. Flow voids of superior sagittal sinus are maintained in all 3 sequences. (d) Magnitude and (e) Phase SWI images show blooming in the region of haemorrhage. Also noted is the dilated linear structure showing significant blooming along the posterior margin of the parietal cortex–suggestive of cortical vein thrombosis (arrow). There is no blooming of the superior sagittal sinus. (f) TOF MRV shows normal dural venous sinuses.
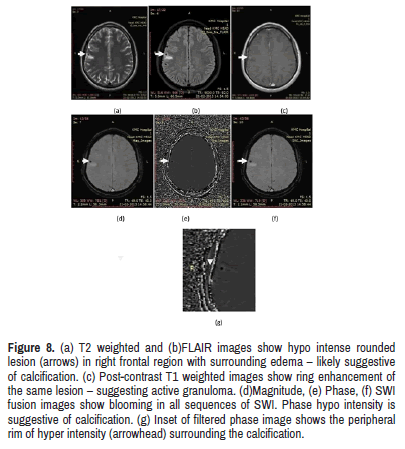
Phase rim hyper intensity was mentioned in a case study by. This was seen in 10 cases out of 14 contrast-enhancing lesions in this study group. Phase rim hyper intensity represents represent blood products.
shows calcified lesion with phase rim hyper intensity (Figure 8).
Figure 8: (a) T2 weighted and (b)FLAIR images show hypo intense rounded lesion (arrows) in right frontal region with surrounding edema – likely suggestive of calcification. (c) Post-contrast T1 weighted images show ring enhancement of the same lesion – suggesting active granuloma. (d)Magnitude, (e) Phase, (f) SWI fusion images show blooming in all sequences of SWI. Phase hypo intensity is suggestive of calcification. (g) Inset of filtered phase image shows the peripheral rim of hyper intensity (arrowhead) surrounding the calcification.
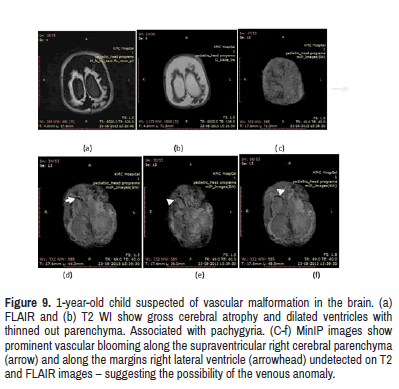
SWI imaging is extremely sensitive in picking up subtle vascular malformations.
Shows MRI images of 11 year old child who present with stridor at birth with seizures. On clinical examination, the child had cavernous angiomas over the skin and along the anterior abdominal wall. SWI MinIP images show prominent vascular blooming along the supraventricular right cerebral parenchyma and along the margins right lateral ventricle undetected on T2 and FLAIR images–suggesting the possibility of the arteriovenous malformation. This was only detected on SWI MinIP images. This is similar to the study done by George, et al. [18] (Figure 9).
Figure 9: 1-year-old child suspected of vascular malformation in the brain. (a) FLAIR and (b) T2 WI show gross cerebral atrophy and dilated ventricles with thinned out parenchyma. Associated with pachygyria. (C-f) MinIP images show prominent vascular blooming along the supraventricular right cerebral parenchyma (arrow) and along the margins right lateral ventricle (arrowhead) undetected on T2 and FLAIR images – suggesting the possibility of the venous anomaly.
Conclusion
In conclusion, SWI was more sensitive than conventional sequences for the detection of hemorrhagic transformation of acute stroke. Venous congestion in the region of infarction was detected only on SWI sequence. SWI MCA sign was more sensitive than FLAIR hyper intense MCA sign. Detection of micro haemorrhages in diffuse axonal injury patients was 100% on SWI sequences. SWI was more sensitive in the detection of subarachnoid haemorrhage than conventional MRI sequences. SWI was sensitive in the detection of thrombosis in various dural venous sinuses but with significant statistical difference when the conventional sequences were combined and compared to SWI. SWI showed 100% sensitivity in the detection of isolated cortical vein thrombosis. SWI was able to detect intra-parenchymal calcifications which were missed on CT and conventional MR sequences. SWI Phase hyper intense rim surrounding calcifications was associated with post-contrast peripheral rim enhancement on T1 weighted images. SWI was extremely sensitive in the diagnosis of vascular malformations.
Author’s contribution
Dr. Mithun. Shekar and Dr. AjitMahalehas done the conceptualization and data curation; Dr. MerwynFernandes performed the formal analysis investigation; Dr.SonaliPrabhu designed the methodology; Dr.SonaliUllal supervised and validated; Dr.Keerthiraj. Belewrote and edited the original draft.
Statement of Funding
This research did not receive any specific grant from funding agencies in the public, commercial, or not-for-profit sectors.
Acknowledgements
Department of Radio diagnosis KMC Hospitals, Mangalore, Manipal Academy of higher education.
Conflict of Interest
None.
References
- Reichenbach, Jurgen R, Ramesh Venkatesan, Douglas J Schillinger and Daniel K Kido, et al. “Sall Vessels in the Human Brain: MR Venography with Deoxyhemoglobin as an Intrinsic Contrast Agent.” Radiology 204 (1997): 272-277.
- Liang, Luxia, Yukunori Korogi, Takeshi Sugahara and Yoshinori Shigematsu, et al. “Detection of Intracranial Hemorrhage with Susceptibility-Weighted MR Sequences.” Am J Neuroradiol 20 (1999): 1527-1534.
- Mittal, Surabhi, Z Wu , Neelavalli J and Haacke E Mark . “Susceptibility Weighted Imaging: Technical Aspects and Clinical Applications, Part 2.” AJNR Am J Neuroradiol 30 (2009): 232-52.
- Edelman, RR, Johnson K, Buxton R and Shoukimas G, et al. “MR of Hemorrhage: A New Approach.” AJNR Am J Neuroradiol 7 (1986): 751-756.
- Lingegowda, Dayananda, Bejoy Thomas, Viratsinh Vaghela and Divyata Rajendra Hingwala, et al. “Susceptibility Sign'on Susceptibility-Weighted Imaging in Acute Ischemic Stroke.” Neurol India 60 (2012): 160-164.
- Yanagawa, Youichi, Yoshito Tsushima, Aya Tokumaru and Yasushi Un-no, et al. “A Quantitative Analysis of Head Injury Using T2*-Weighted Gradient-Echo Imaging.” J Trauma 49 (2000): 272-277.
- Ihn, Yon-Kwon, Won-Sang Jung, and Seong-Su Hwang. “The Value of T2*-Weighted Gradient-Echo MRI for the Diagnosis of Cerebral Venous Sinus Thrombosis.” Clin Imaging 37 (2013): 446-450.
- Wu, Zhen, Sandeep Mittal, Karl Kish, and Yingjian Yu, et al. “Identification of Calcification with MRI Using Susceptibilityâ?Weighted Imaging: A Case Study.” J Magn Reson Imaging 29 (2009): 177-182.
- Osborn, Anne G and Karen A. Tong. Handbook of Neuroradiology: Brain and Skull. Mosby (1996).
- Tong, Karen A, Stephen Ashwal, Barbara A Holshouser and Lori A Shutter, et al. “Hemorrhagic Shearing Lesions in Children and Adolescents with Posttraumatic Diffuse Axonal Injury: Improved Detection and Initial Results.” Radiology 227 (2003): 332-339.
- Patel, Mahesh R, Robert R Edelman and Steven Warach. “Detection of Hyperacute Primary Intraparenchymal Hemorrhage by Magnetic Resonance Imaging.” Stroke 27 (1996): 2321-2324.
- Wycliffe, Nathaniel D, Judy Choe, Barbara Holshouser and Udo E Oyoyo, et al. “Reliability in Detection of Hemorrhage in Acute Stroke by a New Threeâ?Dimensional Gradient Recalled Echo Susceptibilityâ?Weighted Imaging Technique Compared to Computed Tomography: A Retrospective Study.” J Magn Reson Imaging 20 (2004): 372-377.
- Jensen-Kondering, Ulf and Ruwen Böhm. “Asymmetrically Hypointense Veins on T2* w Imaging and Susceptibility-Weighted Imaging in Ischemic Stroke.” World J Radiol 5 (2013): 156.
- Schellinger, Peter D, GoÌ?tz Thomalla, Jens Fiehler and Martin KoÌ?hrmann, et al. "MRI-Based and CT-Based Thrombolytic Therapy in Acute Stroke Within and Beyond Established Time Windows: An Analysis of 1210 Patients.” Stroke 38 (2007): 2640-2645.
- Linfante, Italo, Rafael H. Llinas, Louis R. Caplan and Steven Warach. “MRI Features of Intracerebral Hemorrhage Within 2 Hours from Symptom Onset.” Stroke 30 (1999): 2263-2267.
- Boukobza, Monique, I Crassard, MG Bousser and H. Chabriat. “MR Imaging Features of Isolated Cortical Vein Thrombosis: Diagnosis and Follow-Up.” Am J Neuroradiol 30 (2009): 344-348.
- Robinson, Richard J and Sandeep Bhuta. “Susceptibilityâ?Weighted Imaging of the Brain:Current Utility and Potential Applications.” J Neuroimaging 21 (2011): e189-e204.
- George, Uttam, Milan Jolappara, Chandrasekharan Kesavadas, and Arun Kumar Gupta. “Susceptibility-Weighted Imaging in the Evaluation of Brain Arteriovenous Malformations.”Neurol India 58 (2010): 608.
Citation: Mahale, Ajit, Mithun Shekar, Sonali Ullal and Merwyn Fernandes, et al. "Role of Susceptibility Weighted Magnetic Resonance Imaging in Neurological Diagnosis. " Clin Schizophr Relat Psychoses 15 (2021). Doi: 10.3371/CSRP.MASM.062421.
Copyright: © 2021 Mahale A, et al. This is an open-access article distributed under the terms of the Creative Commons Attribution License, which permits unrestricted use, distribution, and reproduction in any medium, provided the original author and source are credited. This is an open access article distributed under the terms of the Creative Commons Attribution License, which permits unrestricted use, distribution, and reproduction in any medium, provided the original work is properly cited.


